As software development continues to evolve in 2023, the use of work breakdown structures (WBS) remains a popular project management tool. A WBS is a hierarchical decomposition of a project into smaller, more manageable components, enabling teams to better plan and track progress. In this blog post, we’ll explore three WBS Gantt Chart examples specifically tailored for software development projects in 2023.
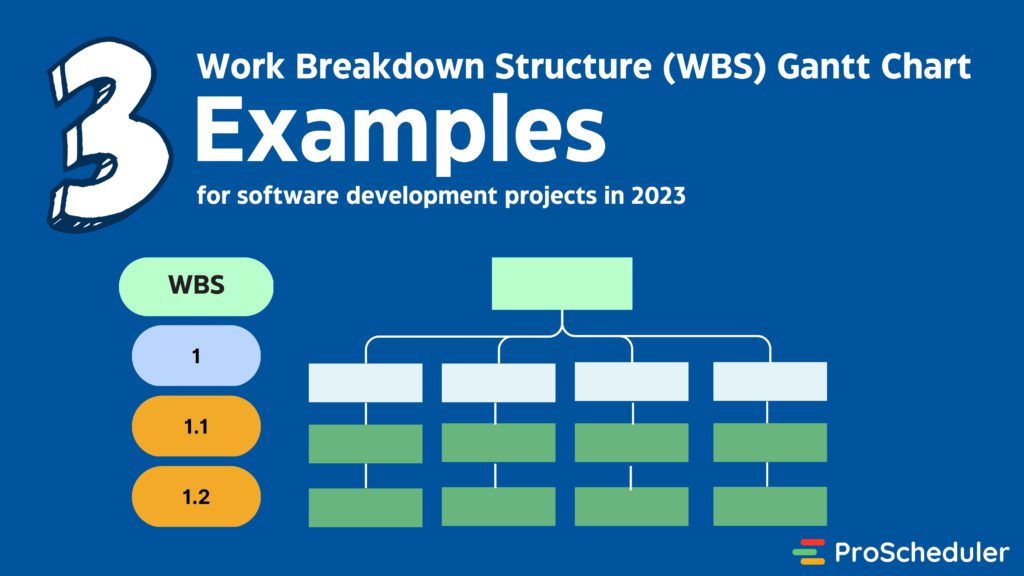
Table of Contents
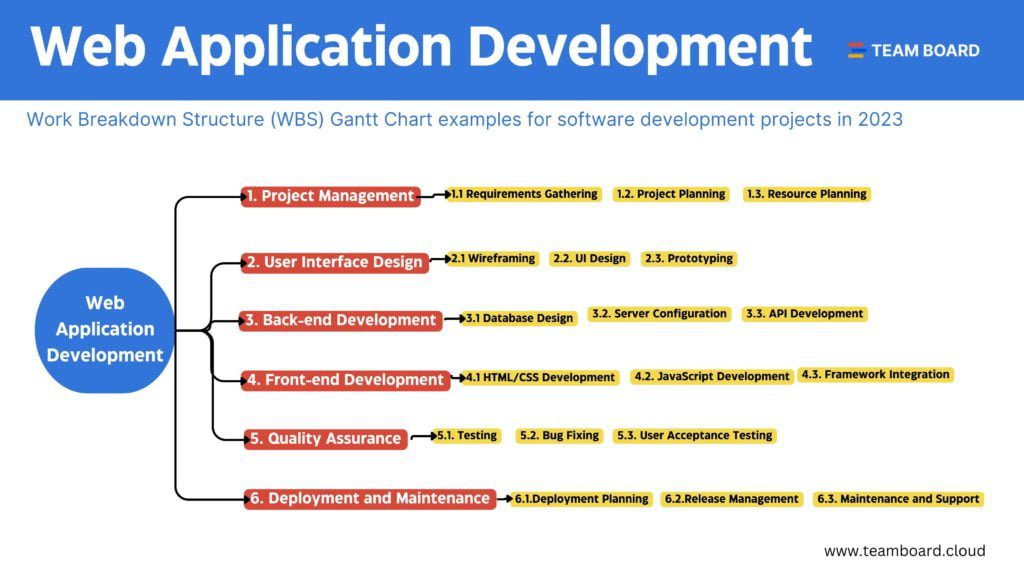
Example 1: Web Application Development:
- Project Management
- Requirements Gathering
- Project Planning
- Resource Planning
- User Interface Design
- Wireframing
- UI Design
- Prototyping
- Back-end Development
- Database Design
- Server Configuration
- API Development
- Front-end Development
- HTML/CSS Development
- JavaScript Development
- Framework Integration
- Quality Assurance
- Testing
- Bug Fixing
- User Acceptance Testing
- Deployment and Maintenance
- Deployment Planning
- Release Management
- Maintenance and Support
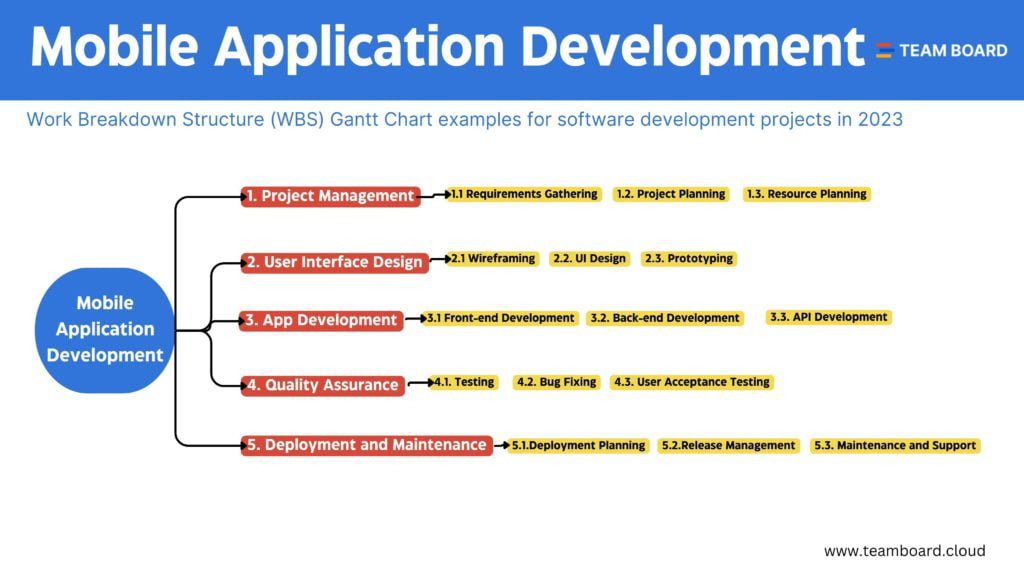
Example 2: Mobile Application Development:
- Project Management
- Requirements Gathering
- Project Planning
- Resource Planning
- User Interface Design
- Wireframing
- UI Design
- Prototyping
- App Development
- Front-end Development
- Back-end Development
- API Development
- Quality Assurance
- Testing
- Bug Fixing
- User Acceptance Testing
- Deployment and Maintenance
- Deployment Planning
- Release Management
- Maintenance and Support
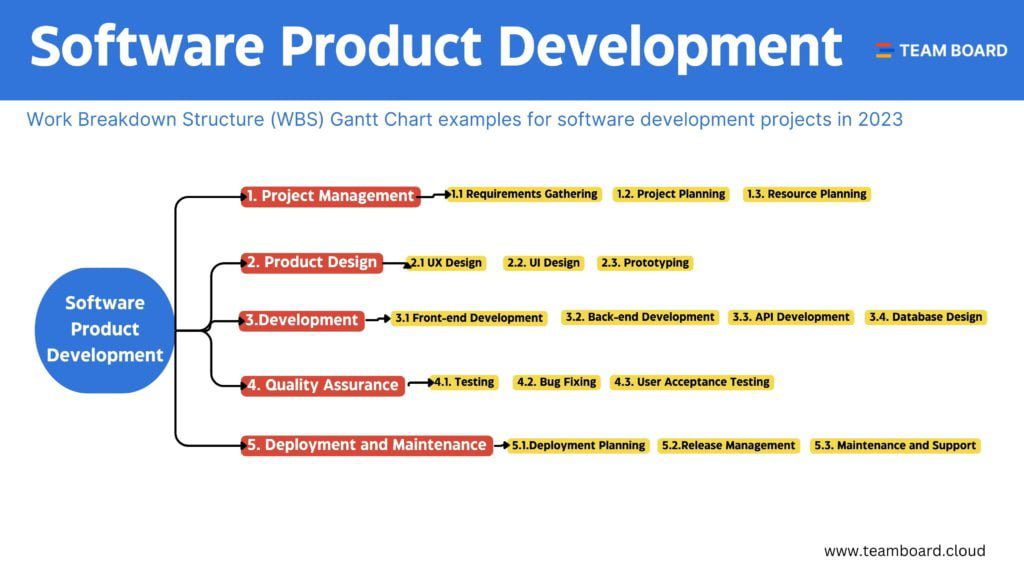
Example 3: Software Product Development:
- Project Management
- Requirements Gathering
- Project Planning
- Resource Planning
- Product Design
- UX Design
- UI Design
- Prototyping
- Development
- Front-end Development
- Back-end Development
- API Development
- Database Design
- Quality Assurance
- Testing
- Bug Fixing
- User Acceptance Testing
- Deployment and Maintenance
- Deployment Planning
- Release Management
- Maintenance and Support
Jira is a popular project management tool used by many organizations to plan, track, and manage their projects. One of the features of Jira is the ability to create a Work Breakdown Structure (WBS) Gantt chart, which helps teams visualize their project tasks, dependencies, and timelines.
In Jira, by using Teamboard ProScheduler – a project management tool, users can create and manage WBS Gantt charts using various features and add-ons.
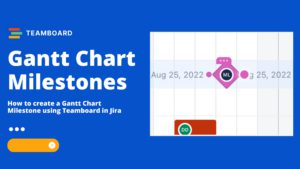
What does a WBS Gantt Chart for Agile Software Development look like on TeamBoard?
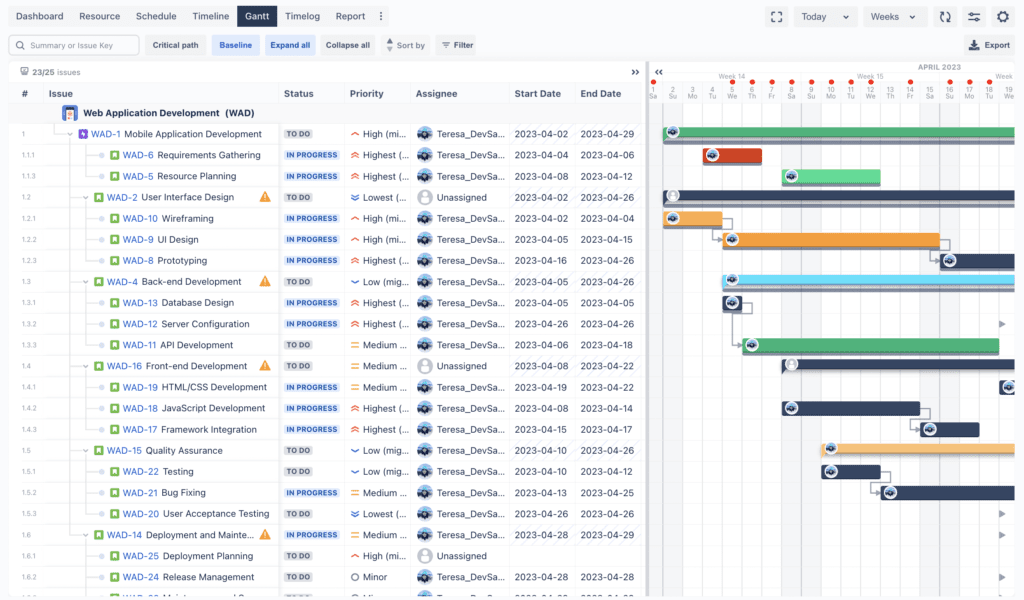
TeamBoard is a collaboration tool that offers various features to help teams manage their projects effectively. One of the features of TeamBoard is the ability to create Gantt charts, which is a popular tool used in project management to visualize project timelines, tasks, and dependencies.
The Gantt chart in TeamBoard looks like a traditional Gantt chart, with a timeline along the top and tasks listed down the left-hand side. The chart allows you to see the start and end dates for each task and how they relate to one another.
To create a Gantt chart in TeamBoard, you can start by creating a new project or selecting an existing project. Then, click on the “Gantt” tab to open the Gantt chart view. From here, you can add tasks to the chart, assign team members to each task, set start and end dates, and add dependencies between tasks.
TeamBoard’s Gantt chart view offers various customization options, such as changing the color of each task, adjusting the time scale of the chart, and filtering tasks based on various criteria. You can also drag and drop tasks to adjust their start and end dates, and update task details directly from the chart view.
Overall, WBS Gantt Chart is a powerful tool that can be used in various software development methodologies, including agile, waterfall, and Dev.