Table of Contents
How To Use Gantt Baseline?
Managing projects is more like a challenging game! And when you have different types of projects, it is only possible to meet some of the deadlines. However, finishing projects on time and reaching all milestones is the toughest task. And that’s where “Gantt Baseline” comes in to provide the needed features for taking a snapshot of the project screen to know where the project stands. It is a very crucial tool for every data manager to hold deadlines and keep an eye on every project’s perspective closely. Let’s find out more!
What is A Baseline?
A baseline is a tool used to manage and track the status of a project. It helps for various purposes and allows you to keep an eye on the project after any changes you have made. It can be used to determine how far along (or behind) the schedule those changes put you in. However, the Gantt chart baseline is a great way to visualize the project’s overall progression over time, and it helps set up a standard by which we can compare future progress.
How Do You Show Baseline In Gantt Chart?
You can create a Gantt baseline in any of your projects by following the steps below:
- First, open your project.
- Click on the Menu.
- Select Baselines and choose “Create New Baseline Set.”
- Now, it will save a snapshot of your current task with its start/end date time.
How To View A Baseline In Gantt Chart?
You can view a Gantt baseline:
- If you click Menu > Baselines and check the box for the baseline you want, you can view it anytime.
How Does Gantt Chart Works?
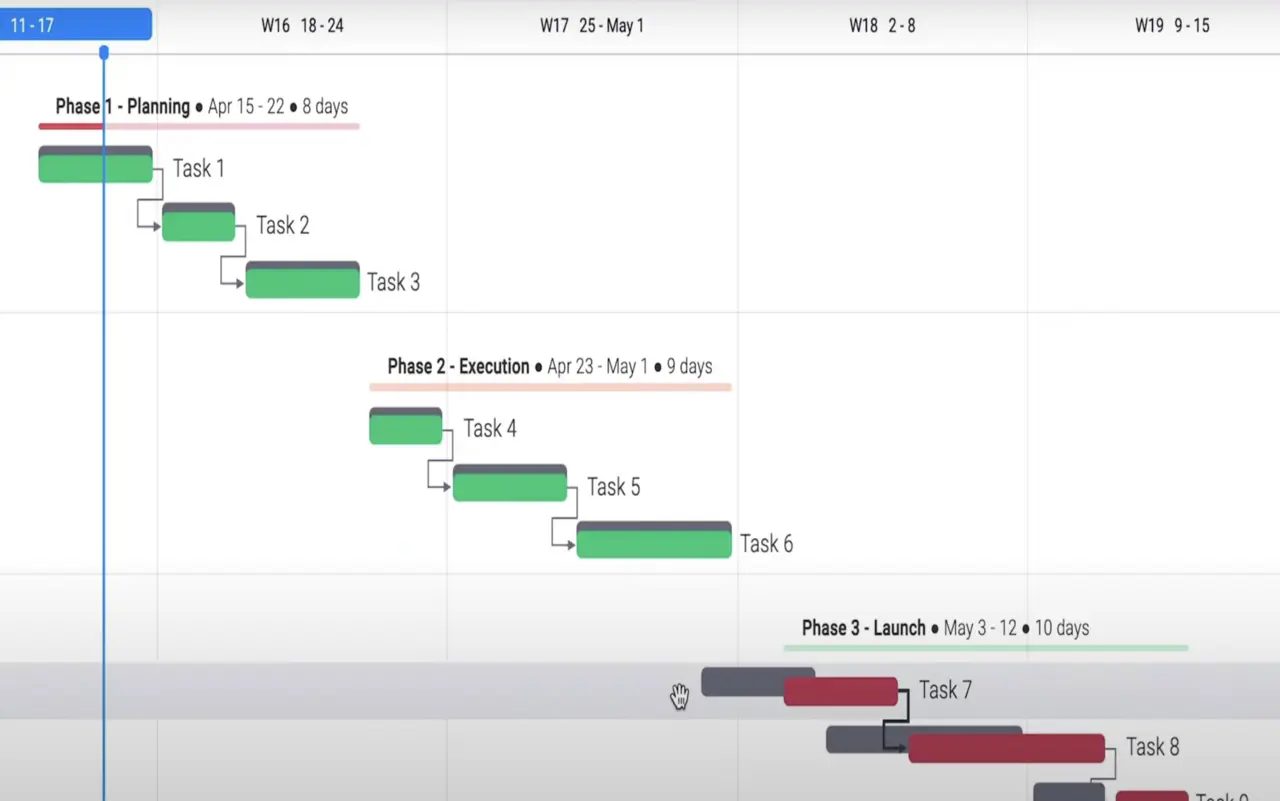
Activities are displayed against time using a Gantt chart, one of the most traditional and useful methods! The charts are horizontal bar graphs showing a project’s plan and progression between its start and end dates. However, dates are laid out horizontally in the Gantt chart, with each bar representing a task.
Let’s visualize the Gantt chart; the left side of the chart is a list that includes all board items with their original names and dates. At the same time, the items are represented in bar form. A full view is shown as a grid, with the vertically listed items against a horizontal calendar. The entire row of an item is highlighted when you hover over it, allowing you to see it at a glance.
The Purpose Of A Baseline In The Gantt Chart?
As mentioned above, the Gantt baseline is a very useful management tool to keep an eye on the project’s outlines, deadlines, and changes. It works like a snapshot to save the original task format before any changes, and managers can see what they did before they make the changes in the projects.
- As a reference, the baseline is extremely useful in project management because it allows you to see how the project progresses after any changes or delays. It helps in various factors, and you will see what you are up to at the project’s starting point.
- Although, Gantt baseline works as a snapshot, and you can have it by clicking on “Baseline” at the top of your Gantt > choosing the option “Add a new snapshot” in the section “Baselines” in Settings.
- Furthermore, when you create a baseline, you will see all the items converting into a shade of gray snapshot (and they will be locked in the current position even if you are going to make the changes later).
- Also, baseline screenshots can be shown or hidden, depending on the requirements.
- Select Edit (pencil) from Menu > Baselines, then hover over the baseline you want to edit or delete. Click Edit (pencil) to change the baseline’s name or delete (trashcan) to delete it. It helps to delete or make any changes in the Gantt chart baseline.
Benefits Of Baseline In Gantt Chart
Here we have summed up some benefits of using the Gantt baseline in a chart to summarize why it is important for project managers:
A Complete Overview
A Gantt chart baseline provides a clear picture of a project’s timeline for both highly involved parties and those with less involvement, such as executives and other stakeholders. It is both visually appealing as well as makes things easier to understand.
Save A Snapshot
As it can save a snapshot, it will be easier for project holders to make any changes in the future and still be able to see what they had before the changes in the form of a screenshot. A simple baseline helps one understand how to manage tasks and deadlines (or if the task needs changes or delays).
Better Engagement
It improves and helps to manage resources and project deadlines. Creating a Gantt baseline chart ensures that the workers and leaders manage their resources and time effectively. However, it improves engagement and involvement with the project and allows scheduling tasks with their starting and ending date/times.
Boost Productivity
To evaluate your project planning and execution, create multiple load baseline sets simultaneously. It allows collaboration with workers easily and builds strong relationships over time. When a baseline is created in the Gantt chart, it further boosts productivity and manages all the load of different projects simultaneously.
Motivate The Team
When the team knows where the project is going and what changes have already been made, it motivates them to keep going with the project. Moreover, the chart illustrates how some must complete tasks before they can begin. This visibility helps the team complete their tasks on time and track ongoing changes.
Conclusion
Gantt baseline is very important for project management. If you are worried about tracking the old project deadlines (after you make changes), create a baseline to find out the real picture of the project when it starts. Make sure your timeline projections are accurate by comparing them with the actual timeline. You will be able to determine which tasks were completed on time. Also, it will be easier to know the schedule of upcoming projects or tasks.
TimePlanner is a time management app that helps you keep track of your tasks, projects, and deadlines. With this app, you can organize your workload, plan ahead and never worry about forgetting an important deadline again.