What is Work Breakdown Structure (WBS) Gantt Chart and 5 Must-Know Tips for Creating a Successful WBS Gantt Chart
When it comes to project management, there are a variety of tools and techniques that can help you stay on track and keep your team organized. Two of the most popular tools in project management are WBS and Gantt charts. These tools are used to break down a project into smaller, more manageable tasks and to track progress over time.
In this blog, we will first explain what WBS Gantt charts are, and then share five must-know tips for creating a successful WBS Gantt chart.
What is a WBS?
WBS stands for Work Breakdown Structure. It is a visual tool that helps you break down a project into smaller, more manageable tasks. A WBS starts with the end goal of the project and breaks it down into smaller and smaller pieces until each task is clearly defined.
A WBS can be created in a variety of formats, but it typically looks like a hierarchical tree structure, with the end goal at the top and the smallest tasks at the bottom. Each level of the tree represents a different level of detail, with the highest levels representing major milestones and the lowest levels representing specific tasks.
Why use a WBS?
Using a WBS helps you:
- Break down a project into smaller, more manageable tasks
- Ensure that each task is clearly defined and understood
- Assign tasks to specific team members
- Track progress on each task
- Identify dependencies between tasks
- Estimate project timelines and costs
What is a Gantt Chart?
A Gantt chart is a visual tool that helps you track progress on a project over time. It is a bar chart that shows the start and end dates of each task in the project, as well as the dependencies between tasks.
A Gantt chart can be used to:
- Track progress on a project
- Identify delays or bottlenecks
- Determine which tasks are critical to the project timeline
- Communicate project timelines to stakeholders
Why use a Gantt Chart?
Using a Gantt chart helps you:
- Track progress on a project over time
- Identify dependencies between tasks
- Visualize the overall project timeline
- Communicate project timelines to stakeholders
- Adjust the project timeline as needed to account for delays or changes in scope
5 Must-Know Tips for Creating a Successful WBS Gantt Chart:
-
Define the End Goal:
The first step in creating a successful WBS Gantt chart is to define the end goal of the project. This should be a clear and concise statement that describes
what the project will achieve. Without a clear end goal, it can be difficult to determine what tasks need to be completed and when.
To define the end goal, start by asking yourself and your team members what the project is supposed to achieve. What problem are you trying to solve? What is the end result supposed to look like? Once you have a clear understanding of the end goal, you can start breaking the project down into smaller tasks.
-
Break Down the Project:
Breaking the project down into smaller tasks is a crucial step in creating a successful WBS Gantt chart. The WBS helps you break the project down into smaller and smaller pieces until each task is clearly defined. This allows you to see the project as a series of manageable tasks, rather than one big, overwhelming project.
When breaking the project down, it is important to start at a high level and work your way down. Begin by identifying the major milestones or phases of the project, and then break each of these milestones down into smaller tasks. Continue breaking the tasks down until each one is clear and well-defined.
-
Assign Tasks:
Once you have broken the project down into tasks, it is important to assign each task to a specific team member. This helps ensure that each team member knows what they are responsible for and can work efficiently.
When assigning tasks, consider each team member’s skills and experience. Assign tasks that play to each team member’s strengths, and provide training or support where necessary. It is also important to communicate clearly with team members about what is expected of them and when their tasks are due.
-
Set Realistic Timelines:
When creating the Gantt chart, it is important to set realistic timelines for each task. Use historical data and experience to estimate how long each task will take, and then build in some buffer time to account for unexpected delays.
It is also important to consider dependencies between tasks when setting timelines. Some tasks may be dependent on others, and delays in one task can have a ripple effect on the entire project. By setting realistic timelines and accounting for dependencies, you can ensure that the project stays on track.
-
Track Progress:
Finally, it is important to track progress on each task and update the Gantt chart regularly. This helps you identify delays or bottlenecks early on and adjust the project timeline as needed.
Tracking progress can be done in a variety of ways, including regular check-ins with team members, tracking actual time spent on tasks, or using project management software that automatically updates the Gantt chart. Whatever method you choose, it is important to update the Gantt chart regularly to ensure that everyone is on the same page and the project is progressing as planned.
Creating a Gantt Chart
Creating a Gantt chart can seem daunting at first, but with the right tools and knowledge, it can be a straightforward process.
Here are the key steps to creating a Gantt chart:
Identify Tasks:
The first step is to identify all the tasks involved in the project. Make a list of all the tasks that need to be completed, and group them into categories or phases as needed.
Determine Task Durations:
Once you have identified all the tasks, determine how long each task will take to complete. Be realistic in your estimates and consider factors such as task complexity, available resources, and dependencies between tasks.
Establish Dependencies:
Next, determine the dependencies between tasks. Identify which tasks must be completed before others can begin and which tasks can be done simultaneously.
Determine Milestones:
Identify key events or milestones in the project, such as the completion of a phase or the delivery of a critical component.
Choose a Gantt Chart Tool:
There are many Gantt chart tools available, both online and offline. Choose a tool that meets your needs and is easy to use.
Input Data:
Enter the task names, durations, dependencies, and milestones into the Gantt chart tool.
Customize the Chart:
Customize the chart to meet your needs. Add labels, adjust the font size, and choose colors that make the chart easy to read and understand.
Share the Chart:
Share the chart with stakeholders, such as team members, clients, and suppliers. This will help everyone involved in the project to stay informed and on track.
Create WBS Gantt Chart for Jira
To create a Work Breakdown Structure (WBS) Gantt Chart in Jira, you can use various plugins or integrations available in the Atlassian Marketplace. One popular plugin that supports WBS Gantt Chart creation is the “TeamBoard ProScheduler” plugin by DevSamurai.
Here’s how you can create a WBS Gantt Chart in Jira using TeamBoard ProScheduler:
- Install Plugin: If not already installed, go to the Atlassian Marketplace, search for “TeamBoard ProScheduler”, and install the plugin in your Jira instance. or go direct from here
- Create a Project: If you haven’t already, create a project in Jira where you want to visualize your WBS Gantt Chart.
- After installing ProScheduler, configure it according to your project needs. You may need to set up resources, task types, and other project-specific settings.
- Create Tasks: Within your Jira project, create tasks or issues that represent the work breakdown structure of your project. Make sure to include all necessary details such as task name, start date, end date, assignee, and dependencies.
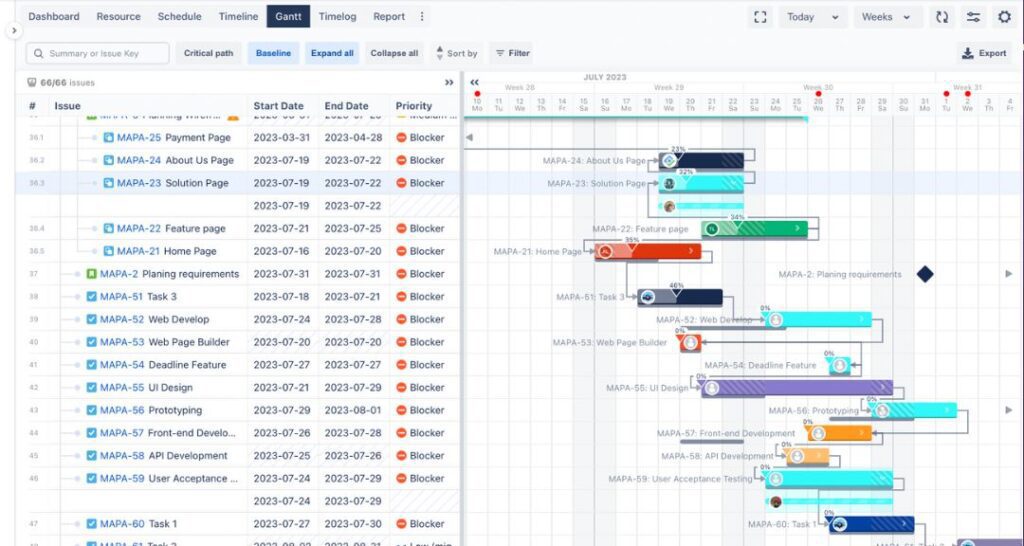
- View WBS Gantt Chart: Select the appropriate project or board, and then choose the WBS Gantt Chart view. Here, you should be able to see your project’s tasks displayed in a hierarchical structure (WBS) along with their respective timelines on the Gantt chart.
- Customize and Manage: You can customize the appearance of your WBS Gantt Chart for Jira, adjust timelines, dependencies, and other project details directly within BigPicture. Additionally, you can manage tasks, assign resources, and track progress using various features provided by the plugin.
- Collaborate and Share: Utilize ProScheduler’s collaboration features to communicate project progress, assign tasks, and share the Gantt chart with relevant stakeholders. You can also generate reports and export data for further analysis or presentation.
Learn more about:
Learn How Teamboard can help you with this
In conclusion, a WBS Gantt chart is a powerful project management tool that can help you break down a project into manageable tasks and track progress over time. By defining the end goal, breaking the project down into tasks, assigning tasks to specific team members, setting realistic timelines, and tracking progress, you can ensure that your project stays on track. Remember that project management is a collaborative effort, and communication is key. By working together as a team and following these five tips, you can achieve your project goals and deliver successful outcomes.