Table of Contents
How to Make a Gantt Chart Professionally
People from particular organizations need to plan, organize and deliver projects timely. As a product manager, you have to acknowledge the product schedule. It isn’t easy to manage multiple activities at a time. Here comes the Gantt charts. They manifest the instructions visually. This chart is a horizontal bar table that outlines all the tasks in a project.
Creating a Gantt chart diminishes the boredom of assigning or managing things manually. They demonstrate the valuable information, duration of the task, and proper setting of a project visually. So, create a Gantt chart and plan, schedule, and manage the task professionally.
Initial Requirements for creating a Gantt Chart
You need to gather the necessary material to answer how to make a Gantt chart. So, before creating a Gantt chart, you should assemble the paraphernalia for a Gantt chart.
Schedule your Deliverables
The deliverables are what you need to make and turn over to your client for a project. You should have a complete record of all the deliverables, and if there are multiple tasks, you should have a track of all.
Plan and meet the Deadlines
It would help if you met your actual deadline. For example, you may work with a team or company to complete the assigned task in time. So, you should do the chores promptly to complete the task within the given deadline.
Creating Milestones
To meet your milestones, you need to break up the particular deliverables into parts. For example, presume you have assigned a task and deliver it to clients in three days. You need to break up the task into steps or parts to finish it timely. You also need to know when these milestones are due as well.
Build your Dependencies
Dependencies are the things needed to complete the project timely. For example, you may need various team members to assist you in getting your task done correctly. So, these are the dependencies you need to fabricate before creating a Gantt chart.
Make a list of Project Handlers and Facilitators
You should make a list of those people who will work on a particular task. The proper enlightenment of your workers is necessary because you need to know who will help you complete your project. This listing assists you in figuring out how to assign various tasks and to whom you should allot these tasks.
As you have set everything ready, now it’s time for creating a Gantt chart. There are multiple methods to do the stuff. Without further ado, let’s discuss how to make a Gantt Chart in a few simple steps.
Creating a Gantt Chart
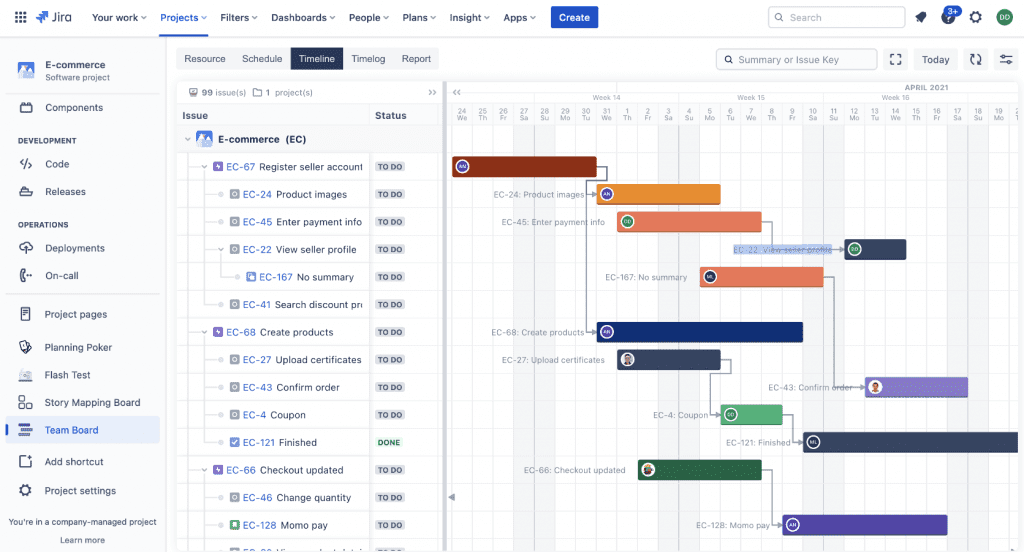
You can use many ways and software to start making a Gantt chart. It depends on the system and services you opt for creating a Gantt chart. There are various software to create a Gantt chart according to your preferences.
For example, the Gantt chart for Jira allows you to overview your issues across one or more projects. You can schedule and assign the projects and plot the resources. You can also have a look at your project progress. Thus, you can anticipate your success.
How to make Gantt Chart in Google Sheets
Google sheets are one of the handy software that assists you in making quality Gantt charts. You can set up the outline and create the Gantt chart using google sheets. Let’s discuss how to make a Gantt chart in Google Sheets.
Step No.1: Create a Bar Chart
Firstly, you have to draw a stacked bar graph under the columns section in the chart. You can also search Google sheets on the browser and click the new button to create a new spreadsheet. You can make more columns according to the number of your tasks.
Step No.2: Input Data and Information
After creating a bar chart, the next thing is to enter the title and precise information regarding your project. After that, you can create as many Gantt chart Google Sheets for particular tasks. You can also personalize your tasks to ensure that each task is under the bar.
For example, you can write Task name, Start date, Duration in the specified columns for table one. You can also sort the tasks by Task # 1 or Task # 2 in the cells. So, after creating the spreadsheet, the next step is to define the titles for particular actions.
Step No.3: Add Start and End Dates
When setting up the dates, you have to do a few mathematical operations. First, you have to put the recording dates in numerical values. Then, if you want to put another date, you have to find the Duration of your date from the first one. For this, one can use this formula, Duration= Finish Date-Start Date. You can also set up the end date at the bottom of each bar on your chart.
Step No.4: Insert a Stacked graph
You can also insert a stacked graph on your spreadsheet to visualize your project progress. Then, you can transform this stacked graph into a Gantt chart.
How to make Gantt Chart in Excel
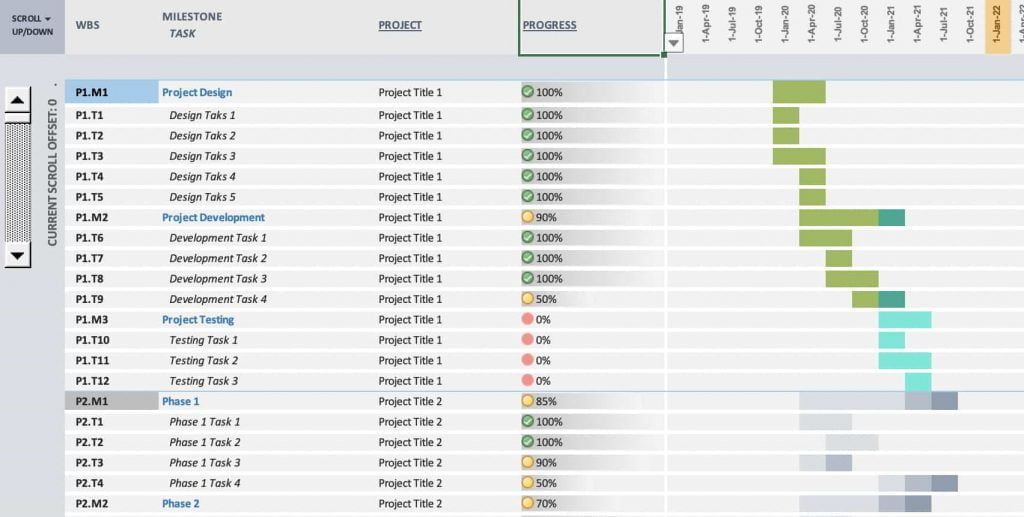
The process of creating the Gantt charts is quite similar in google sheets and Excel. But Excel comes with more features. So, you can follow the steps to make your Gantt chart in Excel.
- Excel has a bar chart feature, and you can format it into Excel Gantt charts.
- You can schedule your task as a separate row. Organize the start, end dates, and Duration of your project plan.
- Also, you can add task descriptions to your particular tasks.
- The last step is to transform your bar graph chart into your Gantt charts.
Some Drawbacks of creating Gantt Chart Google Sheets and Excel
The Gantt chart Google sheets or Excel does not provide many options to create these charts regarding formatting features and tools. In addition, these formats don’t have enough potential to generate dependencies. You also find trouble in calculating the mathematical operations.
These platforms also make it difficult for you to customize your Gantt chart. Setting up your chart is more time-consuming in Excel. Adding more details also makes it messy. So, you need to use more professional software with many features to create your chart.
How to make Gantt Chart with Pro scheduler
After getting the required information, you need to create chart using one of the best software to create Gantt Chart. ProScheduler makes it easy for you to make your first Gantt chart. Once you are familiar with the tools and features, you can also move to the advanced options.
Step No.1: Make your Account First
Firstly, you have to create your account. You can also begin with a free tutorial. Then you will fill all the requirements, and the system will let you make your first chart. The procedure is not too complex. Once you start using this software, you’ll know the tactics and quickly build your chart.
Step No.2: Manage your Project and Tasks
In the next step, you have to create your project and task. This step is quite simple. You’ve to click the start button to customize your project. You can also decide the location where you want it to be stored. Also, you can add the name to it. So, your first product is almost ready.
Next, you have to create your tasks. For this purpose, you have to press a task button. You can add multiple tasks you want to assign using ProScheduler.
Step No.3: Customize your Tasks and set up the Dates
Customization of tasks is usually done to make the chart user-friendly. You can customize your task by adding the name of the particular task, its agent name, and the sub-tasks’ names. This layout manifests how and when the tasks are going to be completed.
Now, it is time to set the dates. You can quickly put the dates just by clicking on the chart for the first date. You can also add the end date to your chart by pressing the click button. Whether the format is short or long, the ProScheduler supports any design and adjusts the time frame according to your choice.
Step No.4: Customize your Gantt Chart Table
It is easy to customize instead of Excel or Google sheets on ProScheduler. It is the best platform to customize your Gantt chart. You can choose any color for your chart. While managing the chart, you can marshal everything according to your preference. So, ProScheduler provides advanced options for customization of your chart.
That’s all; you have done it! Isn’t it simple and fast!
The Bottom Line
Undoubtedly, the importance of Gantt charts for easy scheduling can’t be ignored. All you need is to download the ProScheduler as it’s quicker and more reliable in managing Jira issues, creating timelines, and building roadmaps for easy project management.
Additionally, it will assist you in creating budget reports and managing the project’s costs. In short, you can cover the whole resource planning phase without switching between applications.
Just enjoy the free testing by yourself!